


Time and money
AI has changed the nature of software development, with ever-increasing amounts of code attributable to AI rather than humans. DX measured this at 52.7% of all code in Q2 2026, up from 24% two quarters earlier.
With AI writing more and more code, the bottleneck shifts to the parts of the SDLC around coding - code reviews in particular are the cause of much angst about what to do now the volume of code being created overwhelms the human capacity to do it
As AI has become more central to the way we build software, one claim is repeated over and over. Pre-AI, the most time-consuming and expensive parts of software development were code generation and implementation. .
The core of the human role is no longer code creation, but code orchestration. Difficult problems have been solved, and the cost of code generation has tumbled.
But is it the case that code generation was in fact the most time-consuming and expensive part of production? Plenty of attention is being paid to code reviews, but what about the parts before the problem reaches the team?
By the time a piece of work reaches product, let alone engineering, mental investment has been made by leaders and “workahead teams,” often for months. None of this time or effort is accounted for. Once the work finds its way to the team, the measurement of progress begins.
In the counting house
DORA is the canonical set of engineering metrics. The purpose of DORA is to measure delivery performance. Its definition of lead time to change starts the clock at the moment code is committed: [”the amount of time it takes for a change to go from committed to version control to deployed in production”. In other words, the main measure only begins after code generation.
ISBSG publishes effort distributions for design, development and test. Planning and requirements creation fall outside its scope because those phases are “often not carried out by the core agile development team.” Of the areas it does measure, development is the biggest bucket by some distance. Across 317 agile projects completed since 2020, design takes 20% of logged effort, development 54% and test 26%.
So, while it seems clear that code generation is the most significant part of the measured half of the software development lifecycle, it’s not clear that all of the lifecycle is measured. Where could such measurements be?
The obvious place to start is SPACE. Nicole Forsgren and her co-authors built the framework on the premise that instrumentation alone doesn’t give you full insights into the developer experience or the software development lifecycle. ”Perceptual data may provide more accurate and complete information than what can be observed from instrumenting system behavior alone”. This is completely fair, and the paper is honest about its own limits. It names several activities as essential to developing software that resist measurement: team meetings and their value, brainstorming and its output, helping team-mates when they need it. The breadth of SPACE helps to give a more holistic frame to the developer experience, but it doesn’t actually look at the parts that go before, particularly in those organisations where ideation sits outside the development team.
This is explained by the people doing the measuring. Teams use data to inspect their progress, but that same data is also used to report upwards. Progress reports, productivity metrics and dashboards all surface data designed to flow upward through the organisation. At each layer, there’s a new abstraction, so detail is lost. Data is summarised as it passes from one level to the next. What happens when there’s nobody to report upwards to?
Not everything counts
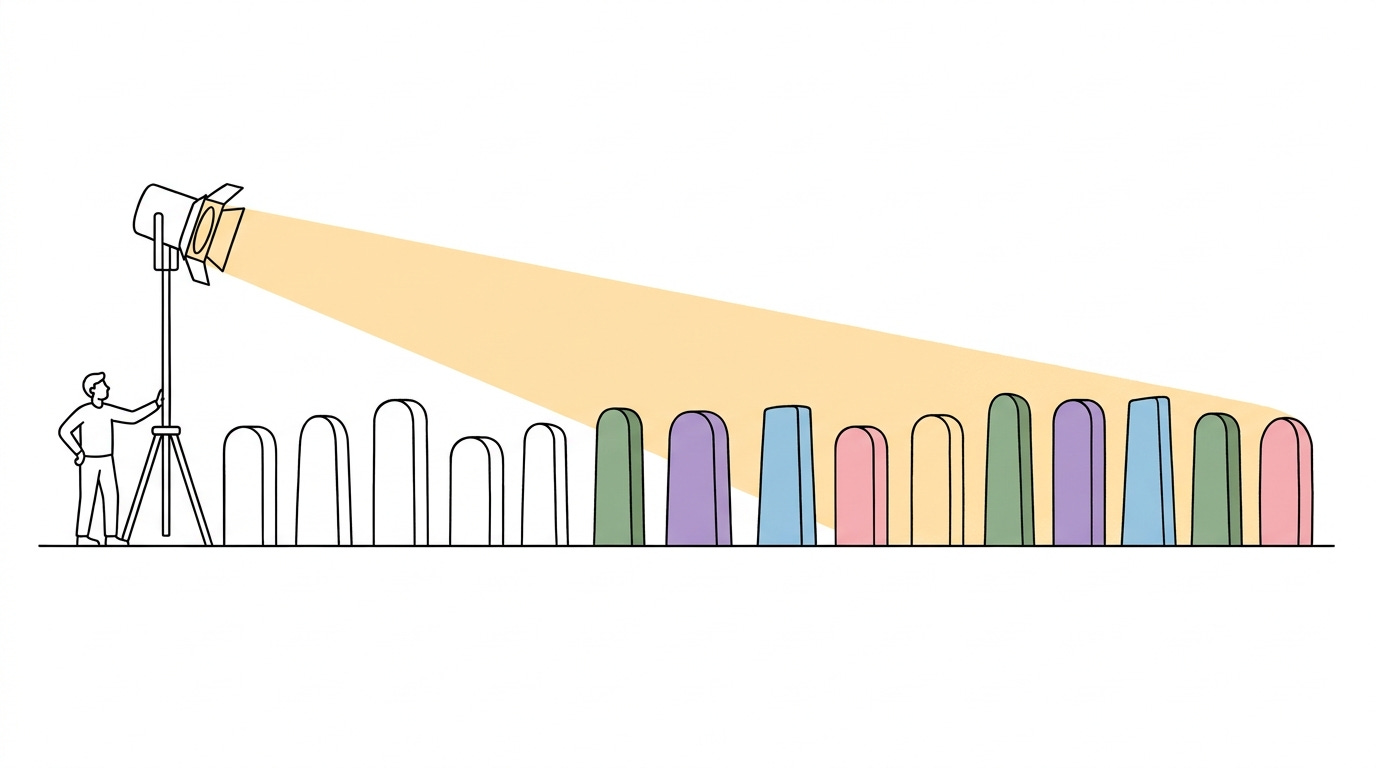
We don’t have an equivalent to the developer experience survey that asks the executive group about the four months of meetings that produced the brief. We don’t have any real measurement of that, because it happens beyond the development horizon. I once participated in a value-stream mapping exercise for a B2B SaaS company I worked for where “engineering was slow.” When we mapped the ideation to production flow, it was over 30 steps long, and engineering didn’t enter the picture until step 23. Importantly, some of the people who were responsible for steps 1 to 22 were in the room, seeing the impact of this for the first time.
They had grappled with the problem, solving large parts of it in their heads. They advanced it so far mentally that it felt like it was already “done.” Then, Product and engineering were introduced to the problem for the first time, and all the work that had to be done to make the solution real and scalable was considered. The leaders were presented back with an estimate for work they had already completed in their minds, and reached their verdict that “engineering is slow.”
The value stream map didn’t support that perspective. More broadly, the data suggests that problems causing friction and delay are not engineering’s alone.
Bain studied one company where a single weekly executive committee meeting consumed 300,000 hours a year across the organisation, once they counted the cascade of preparation meetings feeding it. Their wider observation is the key one: companies manage capital with real discipline and have “no clear understanding of how their leaders and employees are spending their collective time.”
While there are certainly times delivery doesn’t match expectations, it’s fair to inspect the source of that mismatch. Planview measured more than 3,600 value streams among its own customers, and found 40% of engineering work wasted through shifting priorities at C-level. The same data found that only 8% of what teams plan is ever delivered. Some of that will fall on the delivery team, but much will fall on the systems and processes around it, which aren’t so clearly defined. The months of argument before the work arrives, and the changes of mind after it starts both happen beyond the team’s boundary, and neither is marked or measured.
Was code generation ever the most expensive part of building software? DX’s figures show that the time savings from AI in code generation are real, estimated at over 6 hours per heavy user per week, but that isn’t translating into value at the portfolio level. Is the value trapped in the earlier part of the process?
It’s difficult to say because the people wielding the spotlight are never in it.
articulated so clearly and so true!!