

Value stream mapping: don't get stuck in the mud
How value stream mapping can help you find your flow.

When my children were younger, they loved a book called ‘Stuck in the Mud.’ A chick gets, well, stuck in the mud, and all the other farm animals try to rescue it, only to get stuck themselves. The key line:
I’m stuck in the mud, and the mud’s deep and thick.
This is a great allegory for software organisations (no, really!). It happens pretty regularly: an idea or an issue becomes the most important problem for the organisation to solve, either because of executive sponsorship or industry hype. Everyone gets energised about it, there’s nothing else on anyone’s lips, and then…
Nothing happens.
More people get added to the project.
Even less happens.
The organisation is stuck in the mud, and the mud’s deep and thick.
Let’s look at a few examples of how organisations get stuck:
A fintech CTO goes to a conference, and sees a vendor solution that could unblock a high-value fraud detection project. Six months later, the vendor is still in a procurement cycle, with a seemingly endless compliance loop. A competitor launches an identical solution, cornering the $20m market segment.
A Marketing manager has a great idea for positioning a product, but hasn’t got the authority to make it happen. Only the C-suite are empowered to make decisions, so she has to write several presentations and negotiate with multiple gatekeepers to get the idea off the ground. A month later, one of the key sponsors leaves, and the idea sits on the shelf, never to see the light of day.
A project falls behind schedule. Leadership respond by allocating more staff, only to see progress slow, and the project fall further behind.
These examples may seem familiar because they all share a similar cause: organisational processes not keeping up with the needs of the business. Changes that once made sense now cause friction, slowing everything down and eventually, sucking them into the mud. One way to wash the mud off is to map and improve your value streams.
What’s a value stream and why should I map it?
A value stream is how work flows from idea to adoption. It takes account of all the steps and all the stoppages that a piece of work encounters as it travels through your organisation.
“A value stream is the sequence of activities required to design, produce and deliver a good or service to a customer.”- Karen Martin & Mike Osterling – Value Stream Mapping
A value stream is made up of:
Value-adding activities: those activities which are core to the value being delivered, e.g. gathering requirements, design, delivery of code.
Necessary non-value adding activities: e.g. compliance activities, required documentation, security reviews.
Unnecessary non-value adding activities: e.g. redundant documentation, rework, irrelevant meetings, etc.
Mapping the value stream allows you to see where the obstacles to delivery might be in your organisation. It allows you to see the cost of communication overhead and handoffs, illustrating why adding more people isn’t always the right answer.
Isn’t this just a fancy process diagram?
Unlike other business process mapping techniques, value stream mapping isn’t about populating a chart with all the steps taken within low-level processes. The lens is on high-level actions the organisation takes to develop an idea and enable adoption and activation while:
looking at the full set of practices end-to-end,
surfacing hidden inefficiencies,
identifying things that block flow,
documenting handoffs or dependencies and the resulting waiting time,
analysing the way work is done, and
determining strategic enhancements.
Value stream mapping takes a macro view of the entire value stream, examining waiting times and hand-offs between the various steps in the process and identifying opportunities for high-impact improvements. It lifts your focus above local optimisations that often just move problems from one part of the value stream to another.
“Complex creative work can be viewed as having its own value stream - from initial concept to an executable design or to product launch.” - Karen Martin & Mike Osterling – Value Stream Mapping
Who should use a value stream map?
Senior leaders use value stream mapping to agree how work gets done, and to surface unnecessary inefficiencies or delays in handoffs from one step in the process to the next.
The Toyota way
VSM started out as a lean manufacturing technique, first gaining attention as part of the Toyota Production System (TPS). Toyota pioneered lean manufacturing methods. These methods, when applied to software development, gave rise to the lean start-up movement.
What does a value stream look like?
A value stream map shows a flow that begins and ends with the customer. It tracks ideas from conception to adoption, looking at the major steps and handoffs between them. A manufacturing value stream map might look like this:
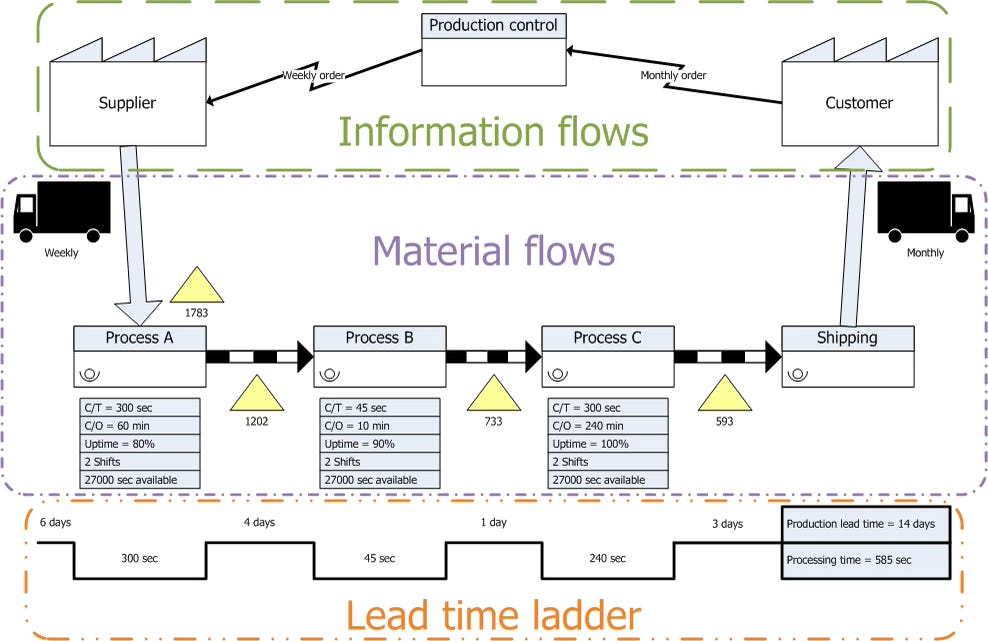
It’s okay to use different shapes. The important thing is to show the key details, which include:
Lead Time: Total time spent on process step, including process time and waiting time (time when work not actively being completed);
Process Time: Time spent actively working in each process step;
Number of People: How many people are involved in each step
%C&A (percent complete and accurate): Did the work exit the step in a way that enables downstream steps to flow?
Barriers to flow: what stops the work flowing smoothly within a step or from one step to the next, e.g.
Process barriers: Batching, rework, lack of prioritization
Resource barriers: Bottlenecks, inaccessible/shared staff, context-switching
Environmental barriers: System downtime, infrastructure issues
How do I get started?
Value stream mapping is high-level, but that doesn’t mean it’s broad scope. You should select a single process that you can track from idea/user problem to delivery. Then you need to gather stakeholders together to map the value stream. It’s important to have stakeholders participate in the mapping exercise so that they can see the process and its issues for themselves. They are not going to get the impact from a report prepared by a well-meaning committee.
How does it work?
Here’s a quick summary of each step for you to follow:
1. Select the value stream
Identify a particular flow of work that you want to map. Be clear about the customer being at the start and end of the flow. Try to keep to a narrow scope.
2. Map the current state
Gather information on how work and information currently flow through the value stream. Interview the people doing the work where the work gets done. If possible, watch them do it or have them show you how they work. Record the steps, how long they take, where work and information is passed to, and how long it takes to be picked up by the next step in the value stream.
3. Analyse the current state
Look for barriers to flow, waste and inefficiencies in the process. Measure as clearly as you can the lead time and process time in each stage. Ask yourself how these can be minimised or eliminated.
4. Document the future state
Mark areas for improvement on your value stream map. Ask what will the value stream look like when these efficiencies have been achieved?
5. Create an implementation plan
What needs to be done to move from the current state to the future state? Who will do it? When will it be done? Set dates for when progress will be reviewed and for when the value stream will be reviewed again to embed the search for continuous improvement.
What should I watch out for?
Buy-in
Before you begin, it’s a good idea to make sure that your leadership team are bought in on reviewing the value stream, and taking action based on it. The issues surfaced by value stream mapping often cross organisational boundaries, or require senior sponsorship to be addressed.
Independence
When value-stream mapping, it’s vital to have an independent facilitator working with the team through the process. I once facilitated a value stream mapping exercise, and as issues became clear, it became equally clear that the issues weren’t were senior leadership thought they were, but were much closer to home. Since I didn’t have any skin in the game, it was easier for me to facilitate conversations that would have been politically uncomfortable for someone directly involved in the area.
Skipping Ahead
It’s always tempting when value-stream mapping to dive into the details or to switch to solution mode while still mapping the current flow. A strong facilitator can keep the group on track, preventing such context switching or getting lost in the weeds.
Defending the status quo
Often during the analysis of the current state, people will start justifying the way work is done rather than dispassionately mapping it, which prevents surfacing of the real issues. The team needs to operate with a ‘no blame’ mindset. The facilitator can help to enforce this.
No Follow Through
This will fall outside the remit of the facilitator for the meeting, so it is useful to appoint somebody who will be held accountable for ensuring that the implementation plan is enacted, and doesn’t become another artefact that may be uncovered by future archaeologists sifting through the waste of your organisation.
Let’s walk through a fictional example of how a value stream mapping exercise works.
1. Select the value stream
Following recent expansion and organisational changes, the leadership team at P&A Utilities have some concern over the amount of time it takes for one of their product teams to turn around work, and they are keen to understand what is causing the apparent delays. This team offers a relatively new bespoke service to high-end clients, so leadership assumes it has a self-contained set of problems.
The leadership team gathers together for a few days to undertake a value stream mapping exercise. They invite members of the team to participate so that they can explain what is happening ‘on the ground.’
2. Map the current state
The leadership spend a morning discussing the work that is done to move from idea to adoption. They talk with the people doing the work, documenting the major steps in the process, and examine any artefacts created.

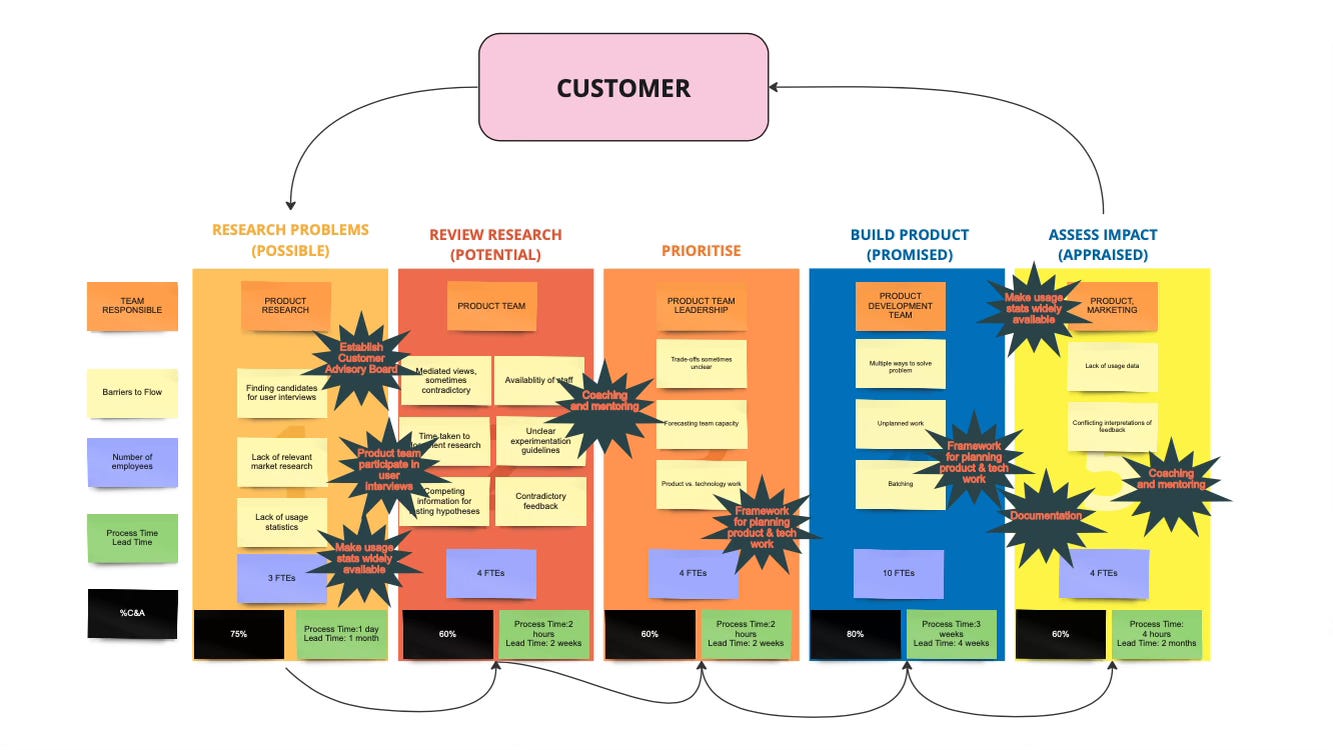
The teams, like all of those at P&A Utilities, follow the PandA framework The value stream maps onto the stages of that framework.
3. Analyse the current state
The leadership reconvene in the afternoon and note the barriers to flow presented by the team and those that are obvious in the process. They record the number of people working in each step of the flow, estimate the % complete and accurate at each stage, and record the process time and lead time for each step, along with the barriers to flow.

There are no superfluous steps in the process that don’t add value and overall the staffing levels seem correct to the leadership. However, the process time for each stage is measured in hours, but the lead time is measured in weeks. This meant that work was spending most of its time stuck waiting rather than flowing through to the next stage.
4. Document the future state
On Day 2, after reviewing the current state and its barriers to flow, P&A leadership gathers to discuss how the future process should work. They identify five specific focus areas, which will impact nine points across the value stream. These points are marked on the value stream map as kaizen bursts.
Focus area 1: Improved feedback
During the Research phase, the product team are not directly involved in user and customer interviews. Researchers complete a report and share this with only a subset of the product team. Everyone on the team is frustrated at the quality of the insights they are getting, with no ability to ‘dig deep’ directly with a customer on any of the issues raised. A quick win is noted - ‘let’s get the team into the research process.’
Finding users for interview and setting up customer feedback loops takes time. The leadership agrees to establish a Customer Advisory Board, creating a panel of customers and users who can be approached easily for research. This should shorten feedback loops and ensure continued access to panels of users, as well as customers willing to support experimentation.
Focus Area 2: Data silos
Given the focus that the PandA framework has on hypothesis-driven development and measuring outcomes, the leadership was surprised to find a lack of usage data being identified as a barrier to flow. Digging deeper, the leadership discovers that the recent establishment of a data platform team has had unintended consequences. Frictions have been introduced to the team being able to access its data. Leadership decides to review its policies with regard to usage data, making logs available to everyone in the organisation, based on team and group permissions.
Focus area 3: Prioritisation
Within the Potential and Prioritised stage of the value stream, the product team complains of contradictory information and a lack of clarity over expectations and trade-offs.
Digging into the problem, it becomes apparent that there’s a reliance on tribal knowledge for some of these activities. As the company has grown rapidly, processes have grown but not been documented. Newer teams, such as this product team don’t have the organisational context needed to work in the same way as others. Investments are planned in training, documentation, and to establish coaching and mentoring relationships for the Product team with other, more experienced people in similar roles.
Focus area 4: Technical debt
The P&A Utilities leadership realise that they have an issue where the team struggles to invest in an appropriate level of technical improvements. A lack of investments in non-functional areas and in team productivity means that the product team have more interruptions than others in the organisation. The leadership decide to introduce a framework to categorise the amount of effort they invest in product work, necessary work, and in addressing technical debt. They will use these observations to help the team adjust its practices to better manage its capacity and plan the different investments it must make, which over time will help to reduce unplanned work.
Focus area 5: Batching
The leadership notes that the team often bundles releases together as opposed to delivering software early and often. Looking into this further, they realise that the team’s strategy for releasing software lacks maturity, so they decide to pair a more experienced Engineering Manager with the team to help with reducing risk and the size of deployments.
5. Create an implementation plan
To move from the current state to the desired future state, the leadership create an implementation plan. As a lean organisation, the leadership at P&A Utilities realises it is not feasible to make multiple changes simultaneously. They ground their planned improvements in a set of hypotheses that they can test.
Phase 1: Democratise data (next month)
The leadership identifies some short-term wins, on which it can build in the following months
Hypothesis
We believe that by giving the teams unfettered access to their usage data and to customer feedback, the teams will be equipped to make better decisions. We will know we have succeeded when product teams are participating directly in user research, and solutions are consistently proposed that refer to customer-reported and usage data.
Actions
Remove restrictions and reverse processes that prevent teams having easy access to usage data.
Introduce training programme for all members of the product team in user research techniques.
Establish Customer Advisory Board for frequent-touch customers.
Extend user interviews to include members of the product team.
Phase 2: Extend knowledge sharing (following month)
Developing further access to data, leadership will also ensure knowledge is shared between staff of differing experience and focus.
Hypothesis
By systematically transferring knowledge, we will increase consistency and reduce confusion around trade-offs. We will know we have succeeded when our developer experience survey reports reduced level of confusion and prioritisation is outside the top five frictions identified. We also expect to see a reduced number of service interruptions and rework.
Actions
Establish a developer experience survey, with a regular cadence, that allows engineers from across the business to report on frictions and successes.
Appoint executive sponsor to oversee documentation of poorly-understood processes. Develop a roadshow and set of artefacts that can be referred to and evolved as the organisation continues to grow.
Establish mentoring and pair programming across and within teams to ensure knowledge and organisational practices are shared.
Monitor DORA metrics (measuring software delivery performance), with particular attention to Change Failure Rate and Mean Time To Recover.
Phase 3: Emphasise technical excellence (month 3)
As the cultural change engendered by better access to data and knowledge takes hold, leadership will seek to embed these changes longer-term in an organisation focused on customer and technical excellence.
Hypothesis
By consistently emphasising the need for technical excellence as a first-class citizen, we will help our teams to understand how to choose to make technical investments, such as investing in scalability. We will know we have succeeded when there is less reported friction, and when we see less unplanned work interrupting the team.
Actions
Establish work categorisation formula, enabling team to track unplanned work and interruptions.
Train product team members to ensure in appropriate trade-offs around technical decisions.
Monitor DORA metrics, with particular attention to Deployment Frequency and Lead Times.
Six months later….
At the same time as they create their implementation plan, the leadership team also book in time to review the impact of their changes six months down the line, which gives their hypotheses time to be disproven. Reviewing the value stream again, they can see that the bottlenecks have been removed from the process. Key improvements include:
A reduction in reported frustration with product research, alongside a reduction in lead time for feedback to the team from 4 weeks to under 1 week.
Documentation is no longer in the top 3 issues reported in developer experience surveys. There have been significant improvements in lead times and change failure rate, suggesting that there has been a step up in system throughput and stability.
Deployment frequency has also increased by 25% as the team has reduced batch size, releasing lower-risk changes more frequently.
One of the interesting benefits of this work for the P&A Leadership was that they surfaced issues local to the team, but they were able to address a number of issues that were in fact cross-cutting, such as the dependence on tribal knowledge. Such problems, while not widely manifested, would have prevented further scaling if not addressed.
By mapping further value streams, they encountered other issues, and were able to address them before they became stuck in the mud the same way that the original team had.
In summary
Value stream mapping is a powerful technique for surfacing issues that prevent work flowing through your organisation. When you can see where work actually gets stuck, you can make targeted improvements that dramatically reduce lead times without adding resources by optimising for flow. If you’re stuck in the mud, jump into the stream.