

Tyranny of the minority
Consent over consensus

Did you know that election results can be wildly different, simply because of the way votes are counted? I had no idea until I was shown by a close friend who’s heavily involved in politics just how distorting these effects can be.
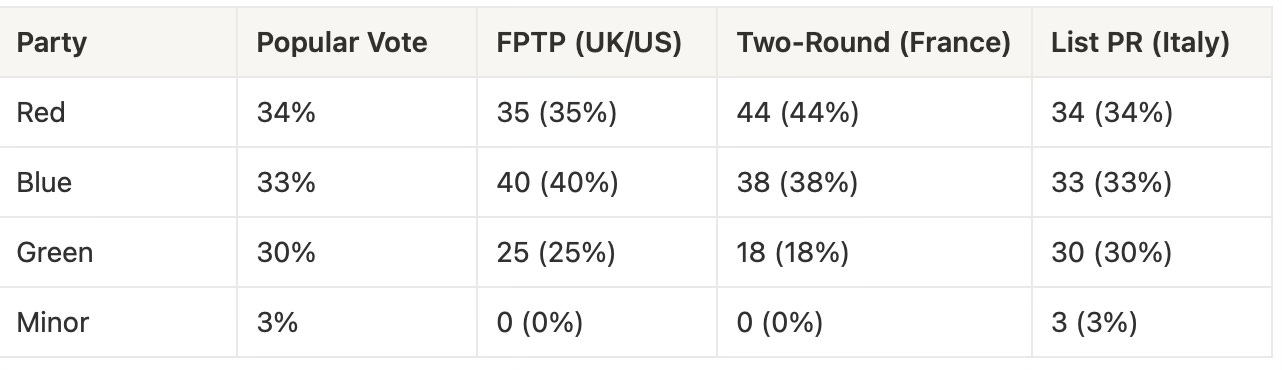
See the results of a simulation generated by Claude in the table below. Notice how the Green Party loses out while the Blue Party thrives in First Past the Post and Two-Round Systems. Full details of the simulation are in the appendix.
As we discussed this, I argued that a more proportional system better reflected the will of the population. She responded with ‘how do you prevent the tyranny of the majority?’
In a democratic system, there is usually legislation in place to protect the rights of under-represented minorities. There’s no such concept of political parties in the business world. Clerical workers seldom get to weigh in on topics such as automation or AI adoption in their organisations.
However, lots of organisations don’t have formal (or informal) decision-making mechanisms, unlike in politics where votes are counted, whether in parliament, elections, or referenda. As a result, we often fall into the trap of seeking consensus, where we become prey to the tyranny of the minority.
Can’t we all just agree?
There’s nothing wrong with aiming for consensus. Decisions everyone can get behind are clearly better than decisions everyone hates. For complex decisions affecting many areas of the business, where everyone has a shared understanding of the greater good, consensus may be best.
However, where consensus becomes the only way decisions are made, or where there are significant trade-offs that impact one party more than another, consensus can run aground. There’s also the risk of ‘consensus theatre’ where a dominant voice or figure announces their perspective and everyone nods along, regardless of their views.
Tyrannosaurus wrecks
I’ve seen examples of both issues several times. I’ve been in meetings where a leader has come in hot with a change, and concerns get steamrolled. The group learns quickly not to object. Consensus is a mirage. I’ve also seen this play out in other areas, where re-organisations get delayed because one participant feels strongly enough to drag out debate and prevent consensus being reached, either by wearing out the group, or running down the clock.
In either of these cases, when apparent consensus is reached, disgruntled parties will often go and tell others ‘well, I didn’t actually support this,’ which reduces the likelihood the decision will actually carry through.
Consent > consensus
In politics, cabinets have the concept of collective responsibility. In other words, in the room, where a decision is made, you can oppose something bitterly, but once the decision is made, you must support it publicly. I’ve seen the same concept applied by successful groups. Sometimes it’s called Agree, Disagree, Commit. I tend to shorten this to Complain and Commit.
In a group built on consent, everyone speaks and offers opinions, and these are used to build and iterate on proposals. When the time for decision comes, the group is strong enough to give up the comfort blanket of consensus if it needs to. It’s useful to have created a guide for how the group makes decisions in contentious circumstances so this can be referred to. These guides should have a top-down view of the path to the best decision the organisation could make and should lean into:
Company vision
Company values
Principles the group follows
Methods that can be used to steer decision-making
Tools and activities that can be used to conduct debates
Where there are strong opinions, it can be difficult to differentiate between obstructionism and genuine concern from others in the group. The leader may need to play a ‘prime minister’ role, encouraging discussion, but then bringing the debate to a close and decision. If compromise can be reached, then fantastic. If not, then the team moves forward with a decision anyway, either based on the majority or the leader’s view, informed by the views expressed. At this point the decision should be considered final, and everyone agrees to commit to it.
The idea isn’t to stifle debate, but to enable progress. It’s a good idea to record the decision and discussions leading up to it in decision logs, where unattributed objections and alternatives are recorded. These artefacts can be used to remind people of the decision, and make it easy for things to be revisited in light of new information.
In a democracy, everyone has a voice. Ideally, no one group can act in a way that brings progress to a halt. Shouldn’t we want the same principles to apply in our workplace?
How to prevent the tyranny of the minority
Agree how decisions will get made if there are contentious debates or strong feelings about a particular issue.
Agree on the principle of collective responsibility.
Timebox debates
Make sure everyone speaks but nobody dominates
Record decision logs, include the different perspectives raised (unattributed).
Appendix: Electoral systems in action
The following simulation was generated using Claude, and it aims to show how different decisions of voting/decision making can distort the power of particular groups.
Country
Population: 10 million
Eligible voters: 7.5 million
Electoral districts: 100 (each with approximately 75,000 voters)
Legislature size: 100 seats
Voter turnout: 70% (5.25 million votes cast)
Political Landscape
Three major parties with roughly equal support but distinct regional strengths:
Red Party
Center-left platform
Strong in urban areas and among younger voters
34% overall national support
Blue Party
Center-right platform
Strong in rural areas and among older voters
33% overall national support
Green Party
Environmental/progressive platform
Strong in suburban and university areas
30% overall national support
Minor Parties/Independents
Various small parties and independent candidates
3% overall national support combined
Voter Preference Distribution
For preferential voting calculations, we need to understand second preferences:
60% of Red Party voters prefer Green as second choice, 30% prefer Blue, 10% have no second preference
55% of Blue Party voters prefer Red as second choice, 35% prefer Green, 10% have no second preference
70% of Green Party voters prefer Red as second choice, 20% prefer Blue, 10% have no second preference
System 1: First Past the Post (UK/US/India/Canada Model)
In FPTP, each district elects one representative, and the candidate with the most votes wins, regardless of whether they achieve a majority.
Results by District Types:
Urban districts (40): Red wins 25, Blue wins 8, Green wins 7
Rural districts (35): Blue wins 26, Red wins 6, Green wins 3
Suburban districts (25): Green wins 15, Blue wins 6, Red wins 4
Final FPTP Results:
Red Party: 35 seats (35%)
Blue Party: 40 seats (40%)
Green Party: 25 seats (25%)
Minor Parties: 0 seats (0%)
Despite having only 33% popular support, the Blue Party wins the most seats due to concentrated support in rural districts. The Green Party is significantly underrepresented compared to their popular vote.
System 2: Two-Round System (French Model)
In the Two-Round System used in France, if no candidate receives an absolute majority (>50%) in the first round, a second round is held between the top two candidates.
First Round Results:
Same as the FPTP initial vote distribution, but only 7 candidates win outright with >50% of votes:
Red Party: 3 seats secured in first round
Blue Party: 4 seats secured in first round
Green Party: 0 seats secured in first round
Second Round Dynamics:
In the remaining 93 districts, the top two candidates advance
Red advances in 37 districts, Blue in 38, Green in 25
With runoff elections, second preferences become crucial
Most Green voters back Red in Red vs. Blue runoffs
Red and Blue voters split more evenly when backing Green against their opponent
Final Two-Round Results:
Red Party: 44 seats (44%)
Blue Party: 38 seats (38%)
Green Party: 18 seats (18%)
Minor Parties: 0 seats (0%)
The Red Party benefits from being many voters' second choice, particularly among Green supporters.
System 3: Party List Proportional Representation (Italian/Brazilian Model)
In this system, voters vote for parties rather than candidates, and seats are allocated proportionally to each party's share of the total vote. Many G20 countries including Italy, Brazil, South Africa, and Turkey use variants of list PR.
For our simulation, we'll use a moderate threshold of 2% (similar to Italy's system) to qualify for seats.
List PR Results:
Red Party: 34 seats (34%)
Blue Party: 33 seats (33%)
Green Party: 30 seats (30%)
Minor Parties/Independents: 3 seats (3%)
This system most closely reflects the actual popular vote percentages, ensuring each party receives seats proportional to their support.
Comparative Analysis
