

Productivity and PandAs
What's wrong with productivity? A fresh approach with PandA

The PandA framework - a refresher
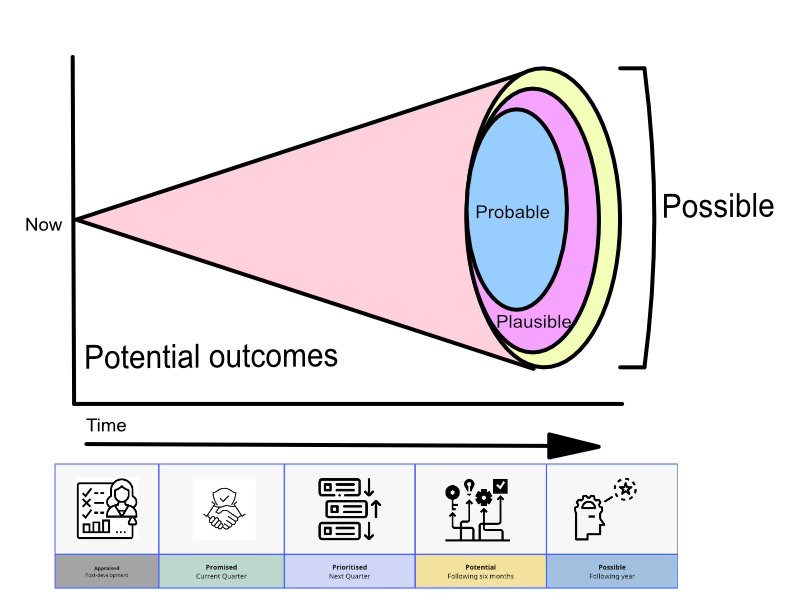
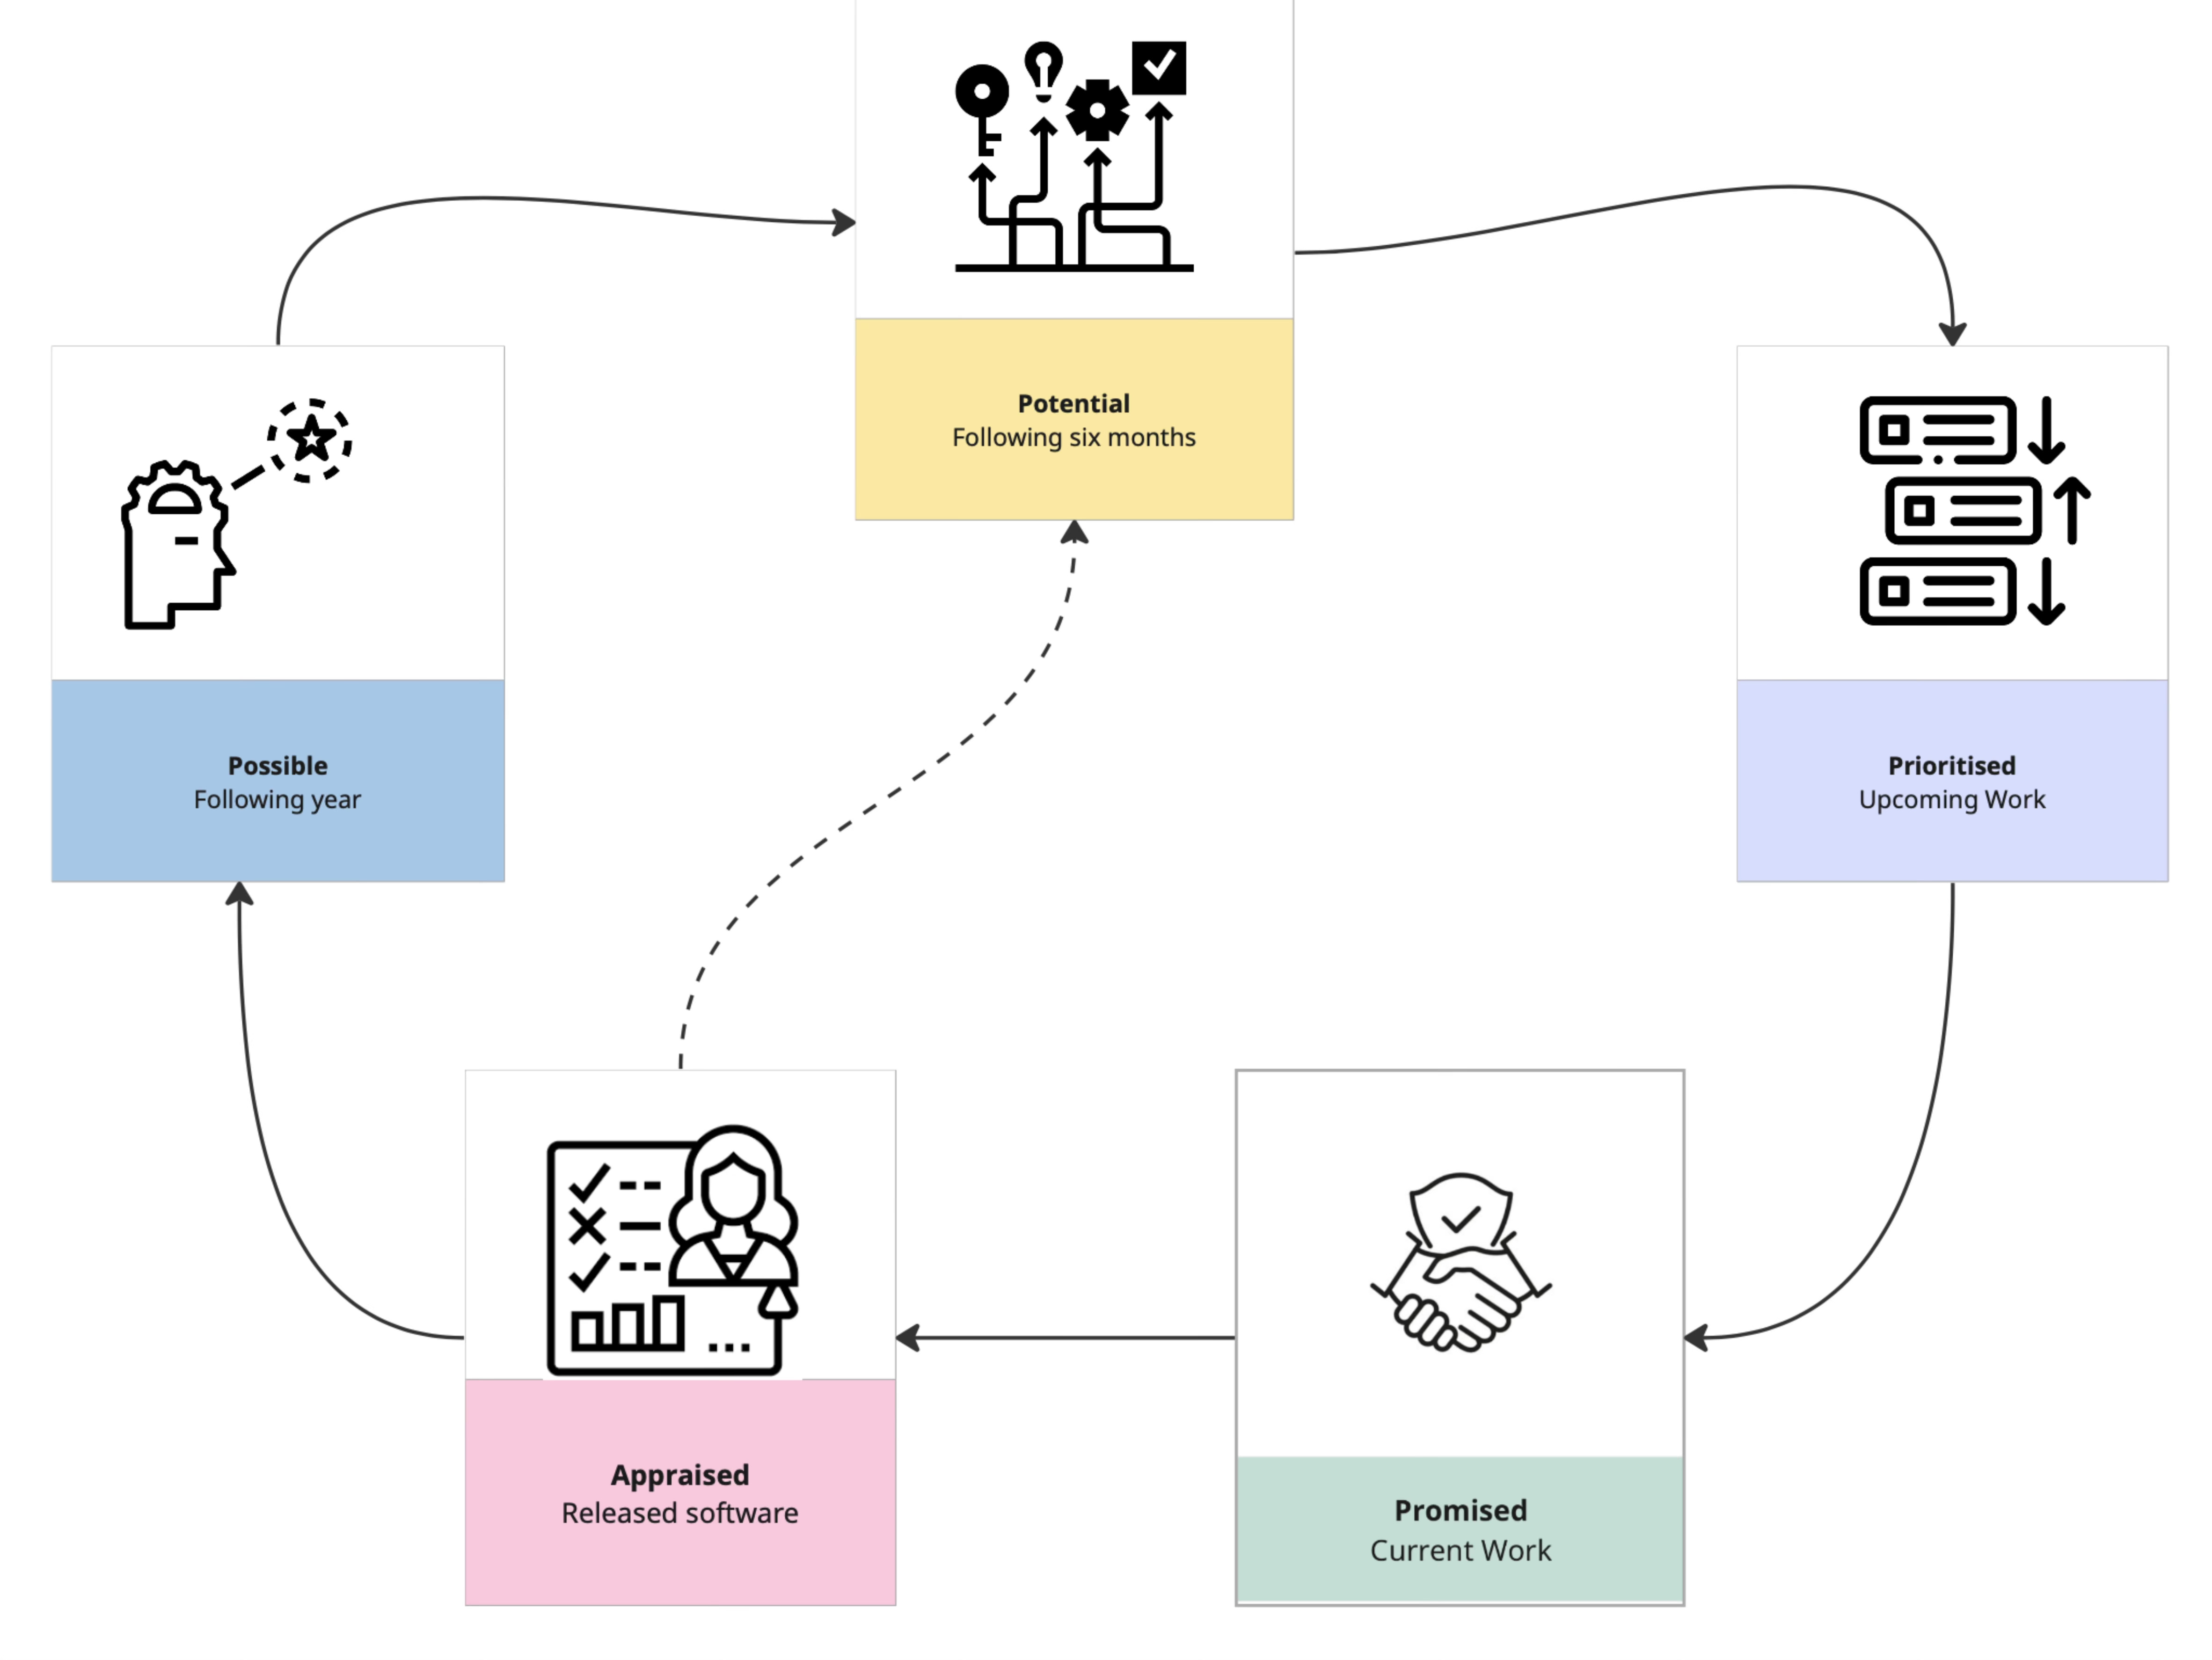
PandA is a product framework that emphasises experimentation and measuring outcomes. It enables teams to create an evolving product roadmap that acknowledges future uncertainty. It does this by splitting the roadmap into a number of discrete phases:
Appraise: measure the impact of what’s already been shipped.
Promised: deliver on planned work in the coming weeks.
Prioritise: make informed choices about work for the coming months.
Potential: test hypotheses and run experiments for work that might be deliverable in the next 6-12 months.
Possible: brainstorm and explore ideas for what could be coming in future horizons, more than 12 months in the future.
The framework emphasises outcomes over outputs, and supercharges discovery and innovation while maintaining strategic alignment and preserving team autonomy.
It also has something to add to the vexed debate about developer productivity. You may want to revisit earlier PandA articles for full context before continuing here.

A brief history of time and motion studies
Concern with productivity is as old as capitalism itself. Farmers have always been keen students of crop yields. Every historic craftsman would have wanted to maximise the profit on any commission.
Systematic measurement of productivity dates back to the industrial revolution. Business shifted from being the preserves of guilds to that of private enterprises, more subject to the rule of law than the rule of master and apprentice. This meant that competitive advantage could be found in innovation and productivity.
The resulting interest in maximising output gave rise to the scientific management of FW Taylor in the early 20th Century. Taylorism, as it became known, measured and optimised processes for efficiency in factories and manual processes, accelerating automation and worker specialisation.
“From an analytical perspective, and assuming fixed prices, productivity growth leads either to an increase in output (and therefore revenue) per unit of input (and therefore cost), or to a reduction in input use (and therefore cost) per unit of output (and therefore revenue).” - Emily Griffell-Tatjé (ed.) et al, The Oxford Handbook of Productivity Analysis
Productivity measures became the vital signs demonstrating the health of a business, in the days when a straight line could be drawn from raw materials or effort to output. Productivity gains lead to increased customer value, and therefore higher shareholder value, the bottom line for every corporation.
In or out?
When it comes to knowledge work, it’s not quite so straightforward to create that straight line between input and output. What’s the unit of input of software engineering? Is it a software engineer? A function call? Is an API that is called more frequently than another more productive?
What’s the unit of output for that matter? We could take the Scrum definition of an increment of working software, but if we’re going to say that a team is productive based on its delivery of working software, what happens if nobody uses the software? Is a team that delivers output frequently on a product that’s losing money really productive? Is a team that delivers buggy code frequently highly-productive?
Fit to measure?
There have been many attempts to define what productivity means in a knowledge-based industry. The term ‘developer productivity’ has resisted consistent definition. Without understanding what something is, or how to measure it, any attempt to optimise it is doomed to failure.
This is where traditional management approaches come unstuck. Productivity is too often used as a byword for reducing costs or headcount, without the associated increases in efficiency. The cry tends to be “Can’t we just make them go faster?” instead of serious consideration of how to reduce frictions or augment experience.
This has given rise to misguided metrics, such as lines-of-code, which tells you little other than how long a program is. It’s not a reasonable guide to the complexity, quality or value of the work delivered.
The first scientifically-validated approach were the DORA metrics published in 2014 by the team at DevOps Research and Assessment.
The DORA metrics have four core measures:
Lead time for change: the amount of time it takes for a code commit to reach a customer.
Deploy frequency: how often the team releases software to production.
Failed deployment recovery time: the amount of time it takes to restore service after an interruption or customer-impacting incident caused by a deployment.
Change failure percentage: the % of deployments that result in a service incident or outage.
The first two of these measures help give insights into a team’s throughput. The latter two offer insights into the stability of its software. This gets us some of the way to an assessment of the team’s productivity.
Throughput and stability are good proxies, allowing teams to ensure that they’re making the right decisions around quality versus speed, but it doesn’t give any indication as to whether they’re building the capabilities that increase shareholder value.
As the first set of metrics that were scientifically validated, based on years of industry data, DORA represented a great leap forward for the industry. For the first time, we had objective measures and benchmarks, which in turn could help surface systemic bottlenecks in delivery. We still, however, lacked a measure of customer value, and therefore shareholder value.
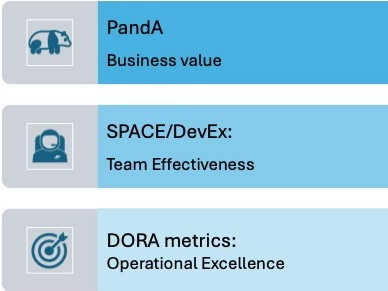
Lots of work has been done on extending the DORA framework, with the authors going on to create SPACE, which measures Satisfaction, Performance, Activity, Communication & Collaboration, and Efficiency & Flow. More recently, they publishedDevEx, which focuses on Cognitive Load, Feedback Loops, and Flow State.
These frameworks focus on removing frictions from the developer experience. By taking a more holistic view of developer happiness, the authors argue that productivity growth will follow. It seems self-evident that removing frictions will increase throughput and stability, but this definition of productivity is still too internally-focussed. The reliance on self-reported metrics create the risk that companies become overly focused on addressing developer needs, but don’t sufficiently incorporate business value into their improvement efforts.
PandA
PandA looks to address this gap by connecting business value with product teams’ daily work. By layering PandA on top of these proven approaches to developer experience, we can demonstrate how internal efficiency gains translates into strategic business outcomes.
PandA emphasises two things that are missing from many product development teams today. Firstly, the creation of product hypotheses, whereby we state our expectations of how the product we’re building will lead to a meaningful change in human behaviour. These hypotheses and experimentation around them enable us to decide what potential ideas we should prioritise.
The second is the ability to ascribe and measure value directly back to product teams’ efforts through appraising the impact of released software.
1. Hypotheses - a reminder
The key to making this work is having a high-quality hypothesis. A product hypothesis states two things. First, what you expect to happen by taking a certain action. Second, how you’ll be able to measure whether your expected outcome followed, or your hypothesis was falsified. Here’s an example of a hypothesis.
We believe that by implementing [x, e.g. a product capability], we will achieve [y, e.g. delivering a particular benefit to a market segment]. We will know we have succeeded when we have observed [z, e.g. a growth in market share in that market segment].
It’s especially important to remember the second half of this formula. Many organisations claim to be hypothesis-driven, but without stating how you’re going to measure success, you’re attempting wish fulfilment rather than the scientific method.
Starting with a hypothesis makes it easier to experiment as you know what indications you’re looking for. More importantly, it enables you to appraise the product capability after it has been delivered. If you’re measuring for the desired outcome, you’re able to speak meaningfully about the impact of the work the team is doing and has delivered.
2. Adding value
Regarding the appraise element of the PandA framework, we need to extend the traditional hypothesis to attach financial value to the expected outcome. For example, a growth in market share may be expected to deliver $10 million in additional revenue. Creation of sensible defaults and platform capabilities could be associated with savings of $1 million.
These extended hypotheses should be time-bounded so that it is clear whether they have been achieved so that the team are held accountable for results. Creating iterative expectations may be help keep feedback loops as tight as possible.
For example, a hypothesis in this situation could state:
We believe that by modernising our architecture, we will create a product that can scale 10x, enabling a doubling in customer growth over the following six months. We will know we have succeeded when we have increased revenue by $50 million over the following 12 months.
Acknowledging this lag between delivery and outcome is crucial. I once worked on a team that got criticised for not achieving its stated aim of 25% growth in adoption following a redevelopment of an onboarding flow. This was because we hadn’t explicitly said that we believed we’d achieve that in the quarter following delivery of the new flow. In the event, we achieved a 300% growth in product adoption the following quarter.
Hypotheses need to be agreed by the team and reviewed with stakeholders. The appraise and prioritise stages of the PandA framework work in unison to prevent gamification. Teams declare hypotheses when deciding what to prioritise and the hypothesis remains consistent until the results that can prove or falsify the results follow later.
Creating hypotheses at the potential stage encourages teams to experiment and judge what might shift the needle. Carrying this hypothesis through consistently to appraise the impact of delivered software enables you to track the efforts made in delivering the software and the outcomes achieved. This in turn creates the opportunity to think of productivity as a function of value created rather than output.
Proposed productivity measure
This new productivity measure would take the form (P = V/E), where V is the value created in dollar terms, i.e. the actual, appraised value of the market impact of the team’s work and E is the cost of the engineering team’s efforts in delivering that work. This takes developer productivity from an internal concern to a business-critical need. Rather than talking about cost-cutting or displacement, we can focus on value creation and innovation instead.
Challenges
1. Feedback loops
An obvious concern is the lag between delivery and outcome. There’s a concerted effort required to measure the appraise stage, and be patient enough to take a long enough view of business results. This can be a significant cultural challenge in fast-paced environments where the incentives are currently based around feature delivery.
2. Hypotheses sound complicated
If you don’t like hypotheses, you can use OKRs (Objectives and Key Results) instead. Objectives are the key outcomes you want to achieve and key results are the ways in which you measure if they have been achieved. OKRs are time-bound, so you should be able to talk about the Key Results that will be delivered in six months or twelve months, enabling you to allow enough time for the business results to accumulate and to take a mature view.
3. Value risk
There’s another concern, which is the attribution of value. How do we know with certainty that we can attribute business value to the work done? This is why hypotheses (or OKRs) are so important. We use the scientific method to state expected outcomes in advance and then measure actual results. This allows us to attribute results to our actions.
4. Organisational complexity
What about platform efforts, or work done by teams with multiple dependencies? PandA in itself doesn’t change the complexity of a delivery which touches many teams, but it does provide an overarching framework and way of thinking about aggregating that effort so that it all becomes visible. Recording effort and outcomes still works, it may require more co-ordination.
5. Indexation
Finally, the organisation needs to be careful to not only see value in revenue terms. Infrastructure investments may have less obvious pay-offs, but can lead to the avoidance of future costs. It can be hard to put a figure on these investments, due to them being exercises in future cost avoidance.
Framing an infrastructure investment in terms of the impact on a DORA or SPACE metric can help to associate it with a value. I’m a strong advocate of accuracy over precision in these situations. Don’t tie yourself in knots getting to precise numbers.
Reasonable heuristics will tell you whether the payoff is worthwhile, particularly if you categorise your efforts, so that you can ensure you’re investing across your portfolio. This prevents you over-indexing on revenue-generation, ensuring you spread your bets across cost avoidance, technical debt platform capabilities, etc.
In summary
Just as knowledge work evolved beyond the assembly line, measuring productivity in knowledge work needs to evolve beyond measures of inputs, throughputs and outputs.We need to evolve into holding ourselves accountable for the value we create.
Are you ready to be productive?